Know Your Numbers in Real-Time
Track doors knocked, appointments set, close rates and team performance. See exactly how your sales operation is performing at any moment.
See It In Action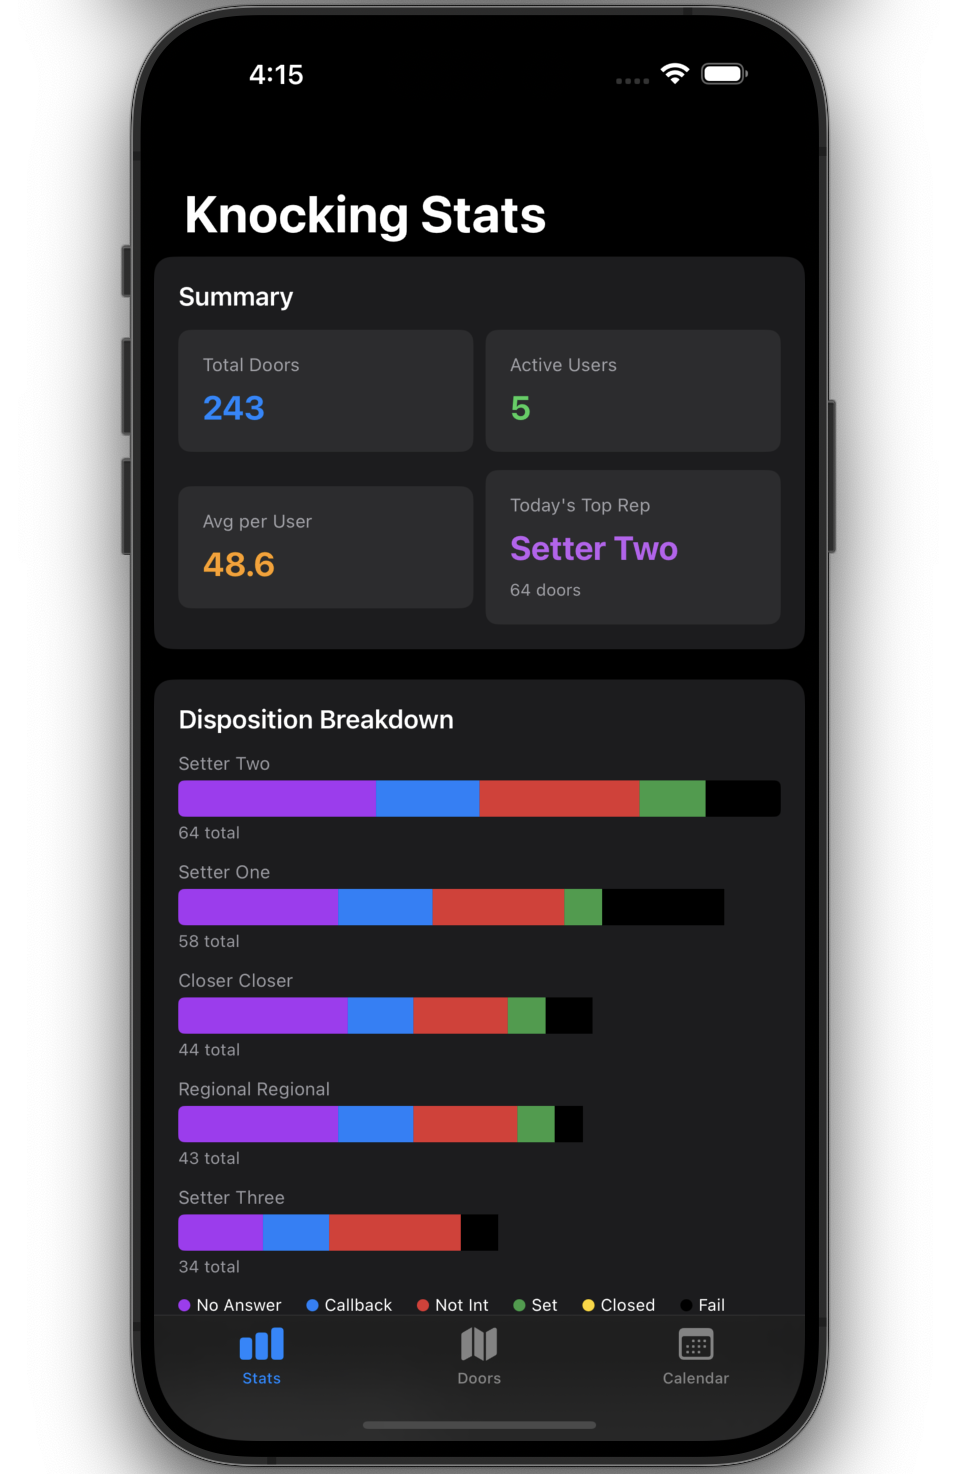
Track Every Door
See how many doors your team is hitting daily, weekly and monthly. Break down by rep, office or disposition to find what's working and what's not.
- Daily door counts per rep
- Historical trends over time
- Disposition breakdown charts
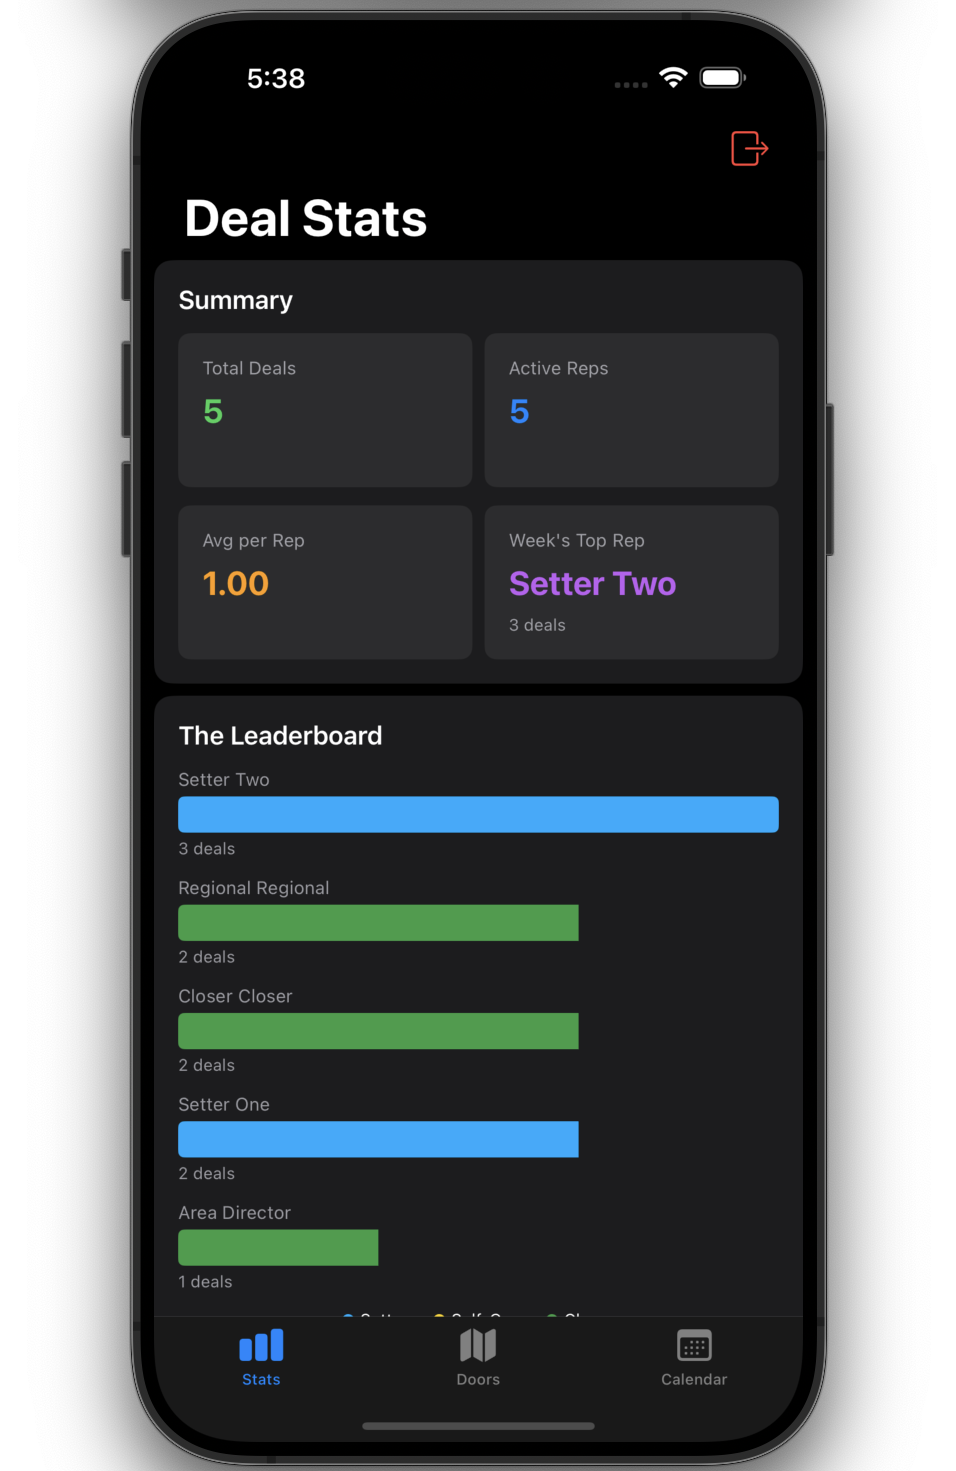
From Knock to Close
Track your entire sales funnel. See how many knocks turn into appointments, how many appointments turn into sits and how many sits turn into signed deals.
- Live weekly leaderboard
- Total sold by rep and team
- Full funnel conversion rates
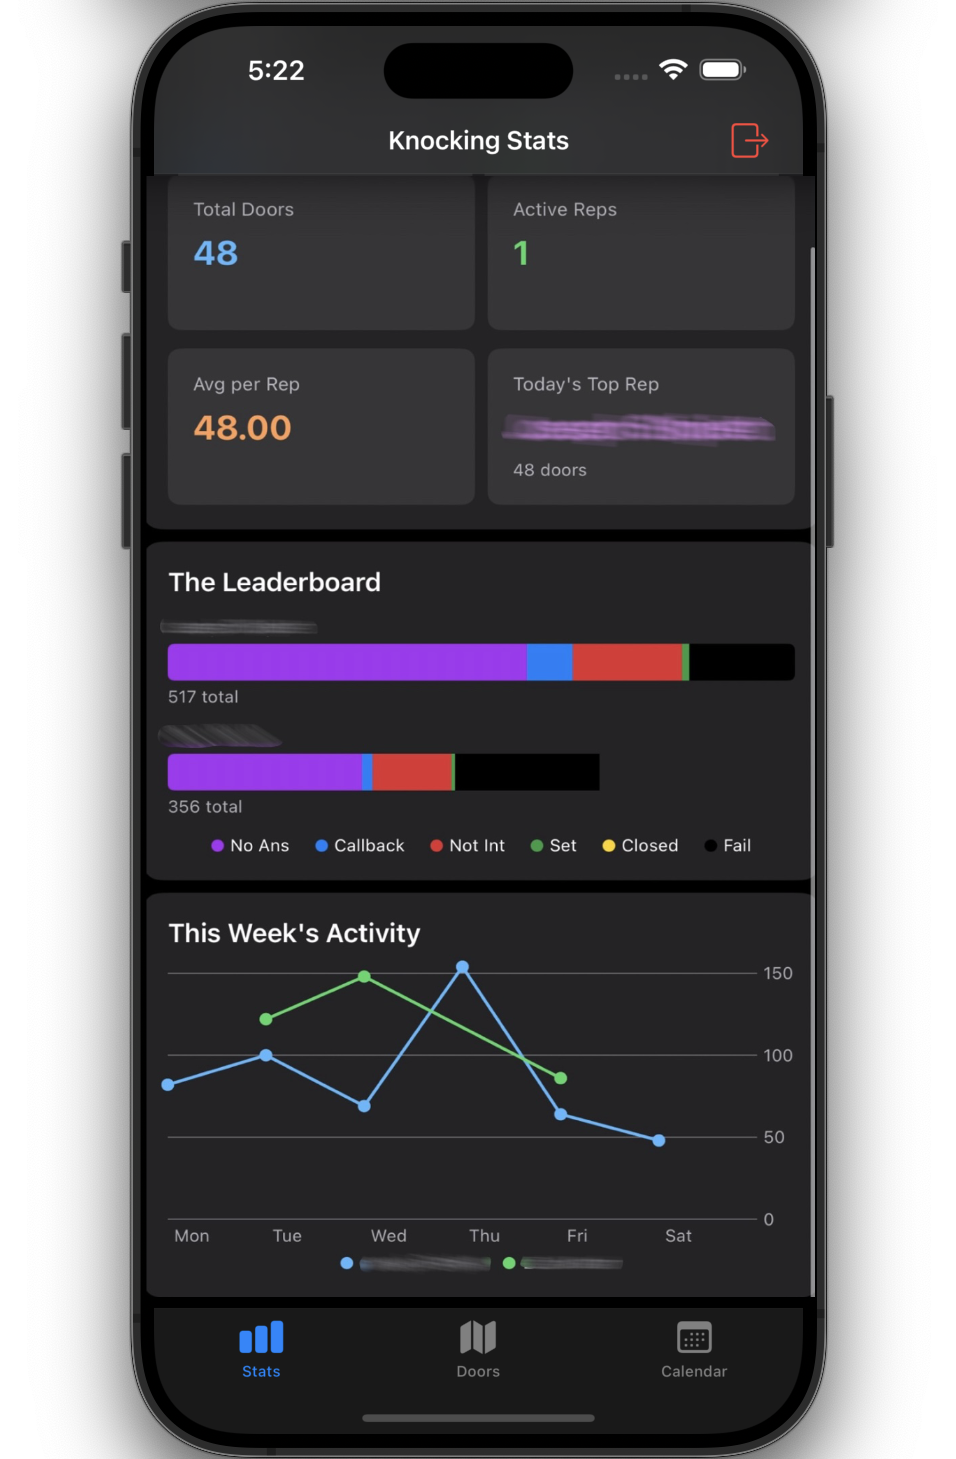
Spot Problems early
Track doors knocked over time with line graphs that reveal trends at a glance. See who's ramping up, who's coasting and who needs a conversation before it's too late.
- Catch declining effort early
- Compare reps side-by-side
- Daily door counts visualized over time
Data-Driven Sales
Stop guessing. Know exactly what's happening across your entire sales operation.
Ready to see your numbers?
Get real-time visibility into your team's performance with SunShip's built-in analytics.